This post is a continuation of this previous post.
Neural Networks are a group of models loosely inspired by a famously powerful computing structure: the brain. The goal of these models is to approximate functions that may have a large number of inputs and whose true natures are mostly unknown. These inputs are taken, weighted, transformed by a function and outputted. This is (hopefully) reminiscent of how a neuron in the brain may have a large number of neurons that feed into it, and if some threshold is exceeded, that neuron will then fire, feeding its output into other neurons. Grouping neurons together can approximate extremely complex relationships and functions. A simple illustration is below.
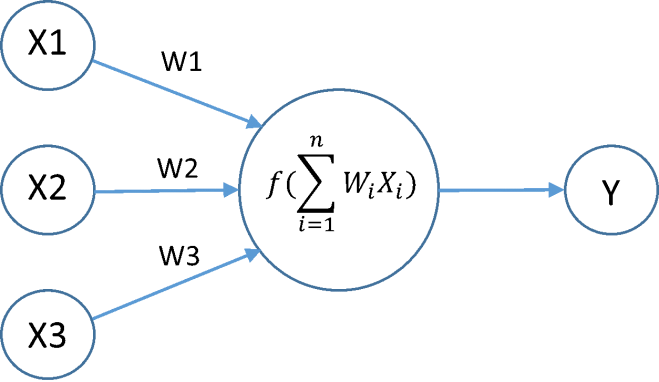
As you can see, the neuron has three inputs: X1, X2, and X3. Those are weighted, which can be thought of as the general connected-ness of the neurons and inputted into the central neuron. Then, those weights are multiplied by their inputs and added together. Based on some transfer function, which can be as simple as negative values are set to 0 and positive values are set to 1, an output is determined and given to the next layer (here Y). This is a small example and not quite how more complex neural networks are constructed. A slightly larger example can be given below.
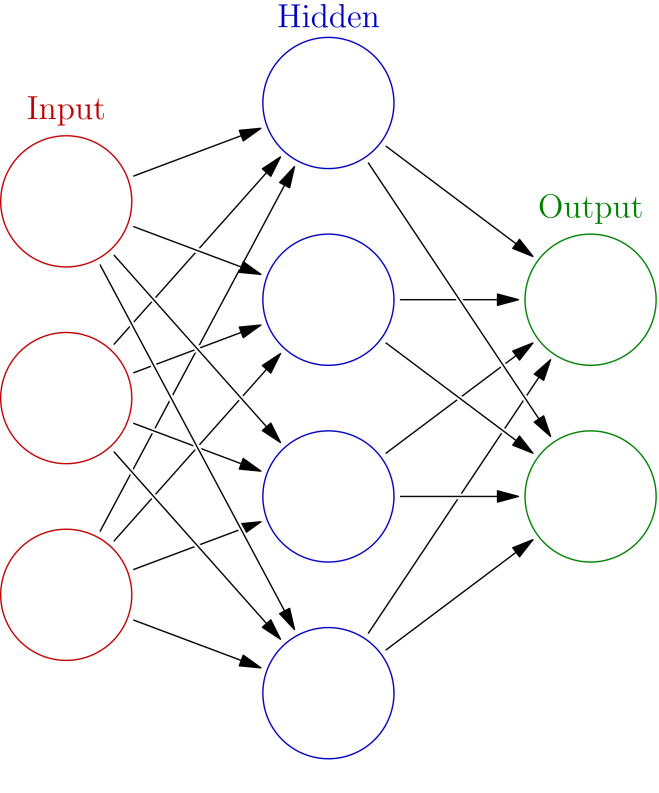
Here, there are still 3 inputs, as before, but now they all feed into 4 nodes, not one. Then those feed into two output nodes at the very end. It is important to notice that this network is fully-connected, meaning every node feeds to every node in the next layer. This network is closer to how “real” networks work than the previous one, but even this is woefully simplistic. The actual process of building a neural network involves changing the weights (W1, W2, and W3 in the first picture) over time so that the output (Y or the two green circles) is closest to what we desire.
By now you may be wondering what on earth this actually has to do with the State of the Union, which I linked to in the beginning of the post. Well in the previous post, I examined whether there was noticeable differences in State of the Union Addresses based on political affiliation, and there kind of was, but there also kind of wasn’t. But a neural network, one with sufficient complexity and trained by someone who at least sort of knows what they’re doing, may be able to pick up on differences that were not immediately apparent.
First, we will use the Document-Term matrix set out in the previous post. In this matrix, each row represents a single State of the Union Address and each column represents a word. The i,j th entry in the matrix is how many times word j is said in State of the Union i. A problem immediately arose, however. There were 19,205 unique words said by presidents throughout these documents, many of which were only ever said in one or a couple of State of the Union Addresses. Including all of these terms would allow the models to concentrate focus on these small incident words and not pick up the larger patterns in the data. Therefore, I would test to see whether allowing words that appeared in 25, 50, or 75% of all State of the Unions worked the best (the way I phrased it in the code was the inverse of that however. In the graphs below the percentage is based on maximum allowable sparcity, in other words the maximum percentage of State of the Unions that couldn’t have that word). Those would include 1554, 709, or 272 words, depending (this means we will have X1… X1554, X1… X709, or X1… X272 for input nodes based on the illustrations) .
The question also had to be answered: what was I actually attempting to predict? There are five political parties that have elected a president: Federalists, Democratic-Republicans, Whigs, Democrats, and Republicans. However, during the history of the US, the Democrats and Republicans have almost switched positions along the ideological scale of Conservative-Liberal. Given that fact, I may choose to use seven parties: adding Conservative Democrats and Liberal Republicans to the previous list. For the purposes of this experiment I will say that the Democrats were conservative from their creation till 1896, whereas the Republicans were liberal from their creation until 1920. The reasoning for this was a combination of ease of use and a (somewhat) trusted source. But then if I’m taking ideology into account, why not simply classify between liberals and conservatives and leave it at that? Since I didn’t have a good answer to any of these questions, I chose to train nine total models: one for each percentage and one for each actual classification task (3 times 3 is 9 for those of you counting along at home). This means we will either have 2, 5, or 7 output nodes, depending on the model
With evaluating neural networks, and statistical models in general, it is important to test your model on an entirely new set of data. For that reason I have split Document-Term Matrix into a training subset of 168 State of the Unions and a test subset of 68 State of the Unions. I will be reporting accuracies in terms of misclassification rate or the percentage of examples that were assigned to the wrong class by the model. The graphs below indicate the learning histories of the nine models. On the Y axis is the misclassification rate and on the X axis is the number of iterations of improvement the weights have gone through as described in the third paragraph (what a journey we’ve gone through together). 1-in-5 classification means the 5 political party set-up, 1-in-7 means the 7 political party set-up, and So in general, unless something goes terribly wrong, we’ll have a downwards trend from the start. These graphs are included below.


These initial models show approximately 20 percent test misclassification for 1-in-5 representation, 18-30 percent for 1-in-7 representation, and 28-40 percent for ideological classification (given that the weights are changed to lower train error specifically, test error is a much better way of checking model quality). These results are somewhat puzzling given that ideological classification has only two classes. Generally, the fewer different groups (political parties here) to classify between, the lower the error will be. This is because random guessing will already get to 50% misclassification rate when classifying between ideologies, but only 20% when classifying between five parties and only 14% when classifying between seven parties. This can be explained in a couple ways. First, the model gets to its best point for ideology much quicker, and test error only increased after that point. Possibly only 100-200 iterations would be needed for ideology. Secondly, ideology does not take into account the way speech over time changed in general, as the more detailed party classification implicitly does given that parties only tend to occur during a specific period of American history (i.e. all the Whig State of the Unions tend to be close to one another in time). That may also be part of the reason 1-in-5 and 1-in-7 seem generally similar despite 1-in-7 having more classes to differentiate. It had a generally harder task, but its classes were also more differentiated over time. For 1-in-5 classification all sparcities (25, 50, and 75%) performed similarly, while for 1-in-7 classification 50 percent allowable sparcity performed the best for reasons I cannot quite explain.
These results are very encouraging though! At their best, these models achieved around 80% accuracy when distinguishing between State of the Unions of different parties or ideologies. This suggests that there may be some fundamental way to distinguish between different political parties’ political speeches. Keep in mind that this only looked at word counts from these speeches, not actual topics and content. That will be looked at through the lens of Latent Dirichlet Analysis, which was discussed on the previous blog post, next time on Land Grant. I’m your host Jacob Jaffe and remember to help control the pet population. Have your pets spayed or neutered!
